In this piece
- The price of coffee is at least three different published series
- A pound of supermarket ground makes about 23 defined cups
- Electricity lands under a penny; the gear line is where the money sits
- Seventy-two cups repays the illustrative gear budget
- The café is also selling labour, rent and a chair
- Swap the two assumed lines and the break-even moves; the gap does not close
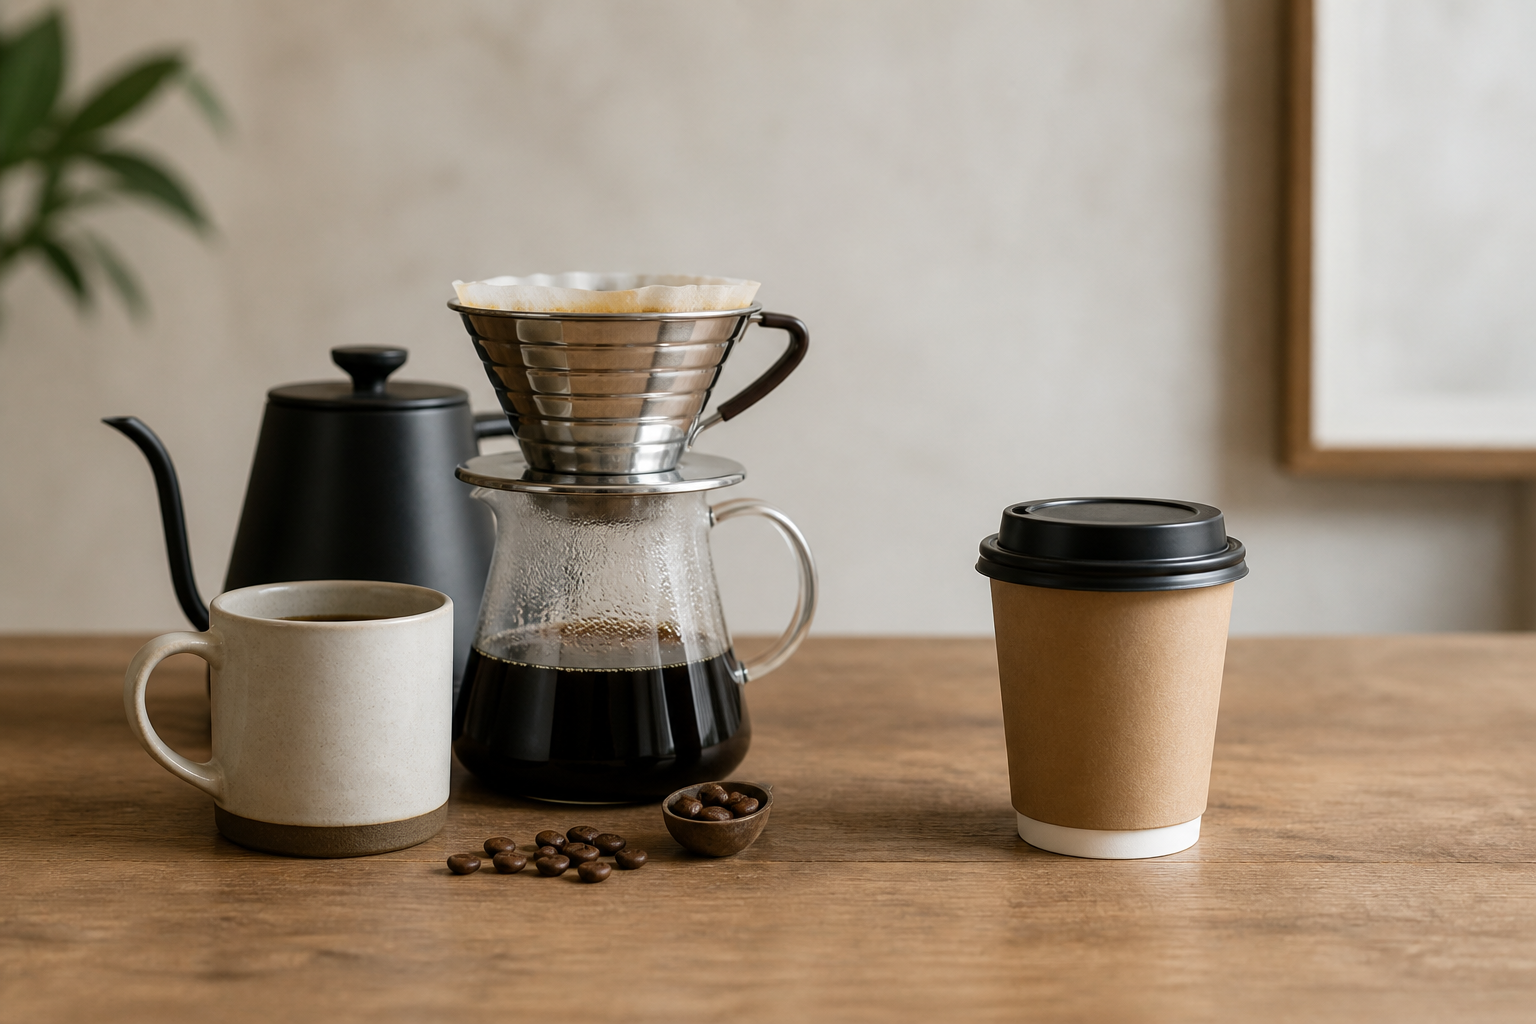
Coffee has several published prices, each measuring something different. A cost per cup gets assembled from three of them, plus a number nobody publishes at all. That last one is why the honest output here is a break-even counted in cups.
The price of coffee is at least three different published series
Start with the beans. The Bureau of Labor Statistics priced ground roast coffee at $9.317 per pound in July 2026, U.S. city average, not seasonally adjusted. That series covers supermarket ground coffee, all sizes. It is the broadest and cheapest tier on the shelf. It went out with the July CPI release on 12 August 2026.
The café side has no federal equivalent. BLS publishes no menu price for a hot coffee, so the comparison has to leave the government series behind. Toast, a restaurant point-of-sale vendor, puts the median at $3.77 for a regular hot coffee in July 2026. That is up 7.4% on July 2025. The figure is a payments vendor’s own published median, drawn from the menus of restaurants on its platform. It is the best number available for the job, and it does not carry the standing a federal series does.
The third publisher supplies no price at all. SCA Standard 310-2021 fixes a brew ratio of 55 g of coffee per 1.000 kg of water. The Specialty Coffee Association wrote it. That URL is a public verbatim mirror, because the association’s own copy sits behind membership. The ratio is a test ratio, written to make brewers comparable under controlled conditions rather than as a recipe for your kitchen.
A pound of supermarket ground makes about 23 defined cups
Set the cup at 350 g of brewing water, a little under a 12-ounce mug. At the test ratio that draws 19.25 g of coffee. A pound is 453.6 g, so a pound yields about 23 cups. Call it a defined cup: the size the standard implies, not the size of your mug.
At $9.317 a pound, 19.25 g of beans costs 39.5 cents. Those same 23 cups bought across a café counter at the median come to $86.71. The remaining lines cannot close that gap. They can still move the break-even.
Electricity lands under a penny; the gear line is where the money sits
The EIA puts the residential electricity price at 18.34 cents per kilowatthour for June 2026, released 26 August 2026. EIA is candid about the method. It calculates average retail revenue per kWh as a proxy for rates, because it does not collect retail rates directly. Assume, illustratively, 0.04 kWh to boil and brew one 350 g cup. That is seven tenths of a cent.
Gear is the line that moves the answer, and it is the line nobody publishes. No national average exists for what a household spends on a brewer and a grinder. Inventing one would be worse than admitting the hole. So state the assumptions and divide.
An illustrative $240 of equipment over an illustrative 4,000-cup life comes to six cents a cup. Four thousand cups is two a day for about five and a half years. Substitute your own two numbers; the method is the durable part. Purchase price divided by the cups it will make before it dies is the whole of it. The case that the grinder is the first upgrade worth making of it is argued elsewhere on this site.
| Line | Cost per cup | Figure behind it | Source | Source period |
|---|---|---|---|---|
| Beans, 19.25 g at the test ratio | $0.395 | $9.317 per lb, ground roast, all sizes | BLS Average Price Data, series APU0000717311 | July 2026 |
| Electricity — ILLUSTRATIVE energy use | $0.007 | 0.04 kWh (illustrative) at 18.34 cents/kWh (published) | EIA Electricity Monthly Update | June 2026 data |
| Gear amortisation — ILLUSTRATIVE | $0.060 | $240 over 4,000 cups, both figures assumed | assumption, no published series exists | n/a |
| Home cup, total | $0.462 | sum of the three lines above | mixed, incl. ILLUSTRATIVE rows | n/a |
| Café, one regular hot coffee | $3.770 | median menu price on one vendor’s platform | Toast, Inc. Menu Price Monitor | July 2026 |
| Difference per cup | $3.308 | café median less home total, which includes ILLUSTRATIVE rows | derived | n/a |
Seventy-two cups repays the illustrative gear budget
Once the gear is bought, it is spent. What governs the decision afterwards is the marginal cup: beans plus electricity, 40.3 cents. Against a $3.77 median that saves $3.37 every time. So $240 of illustrative gear repays itself in 72 cups, which is about five weeks at two cups a day.
Now run it on a specialty bag. Assume double the BLS per-pound price — an assumption, since no published series tracks specialty retail this way. The bean line goes to 79 cents and the marginal cup to 79.8 cents. The saving falls to $2.97 and the break-even moves to 81 cups, roughly six weeks. Doubling the bean price barely dents the payback period, because the café median is so far above both.
The café is also selling labour, rent and a chair
The table prices inputs. A café prices inputs plus a barista’s hour, a lease, a service contract, and somewhere to sit. Subtracting one from the other measures one thing and implies another. A piece that skips that is doing sleight of hand.
There is a quality axis too, and it does not run parallel to the cost axis. Water treatment, grinder consistency and a machine that holds its temperature are part of what $3.77 buys. Why your coffee tastes different at home than at the café takes the same comparison down that side of it.
The table also omits consumables it cannot source. Paper filters and tap water have no published per-cup series behind them. They are small. They are not zero, and treating a table as complete because it adds up is how this genre goes wrong.
The short version
Swap the two assumed lines and the break-even moves; the gap does not close
The gear line and the electricity line are assumptions, labelled as assumptions, because nothing published covers them. Swap in your own and the break-even in cups moves with them, up if the kit cost more and down if it cost less. What does not move is the distance between forty-odd cents and $3.77, because that distance is set by two published series and neither of them is your equipment. Both series move month to month, so re-read them before trusting the number.
Article sources
- U.S. Bureau of Labor Statistics, Average Price Data, series APU0000717311, Coffee, 100%, ground roast, all sizes, per lb.
- Toast, Inc., Menu Price Monitor — July 2026 Median Regular Hot Coffee Prices Rise to $3.77
- U.S. Energy Information Administration, Electricity Monthly Update, Retail Service by Customer Sector
- Specialty Coffee Association, Standard 310-2021, Home Coffee Brewers: Specifications and Test Methods (public verbatim mirror)